
 3 min •
Juraj Ostertag
What Is the Bitcoin Rainbow Chart? Its History and Significance
Bitcoin is one of those assets whose price can go through extremely significant increases and declines over the course of just a few years. When looking at a short-term price chart, it can therefore be difficult to determine whether Bitcoin is trading at a relatively high or low level from a longer-term perspective. This is exactly the kind of context that the Bitcoin Rainbow Chart aims to provide in a simple way.

Over time, the Rainbow Chart has become one of the best-known visual tools within the Bitcoin community. Although at first glance it may look like a somewhat sophisticated analytical model, its origins were much simpler and more informal. The Rainbow Chart was originally created as an interesting way to visualize Bitcoin’s long-term price development rather than as a tool for predicting its future price.
How the Bitcoin Rainbow Chart Works
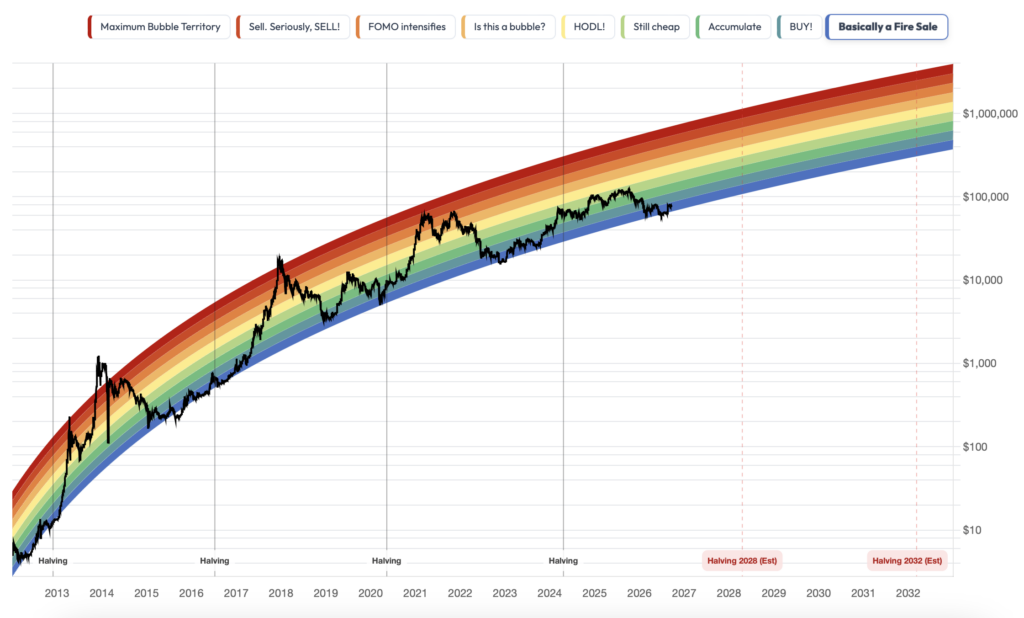
The Bitcoin Rainbow Chart displays Bitcoin’s historical price on a logarithmic scale and overlays it with several colored bands. These range from cooler blue shades at the bottom to warmer orange and red colors at the top of the chart.
The individual bands are designed to give users a simplified idea of where Bitcoin’s price stands relative to its long-term historical trend. The lower bands represent areas of relatively low valuation, the middle bands indicate more neutral periods, while the upper bands show situations in which the price has moved significantly above its long-term trend.
The logarithmic price scale plays an important role in this. Over the course of its existence, Bitcoin has risen from prices measured in single-digit dollars to tens of thousands of dollars. On a standard linear chart, its early years would therefore be almost invisible. A logarithmic scale makes it easier to compare percentage price changes across different periods and provides a clearer picture of long-term development. The Rainbow Chart does not answer the question of what Bitcoin will be worth tomorrow or next month. Its main purpose is to provide a broader perspective and filter out some of the short-term price “noise.”
Rainbow Chart:
Source: BlockchainCenter
Meaning of the Color Bands
The colored bands represent different price zones in relation to Bitcoin’s long-term development. Blue and green areas are located in the lower part of the model and have historically represented periods when Bitcoin traded at lower levels relative to its long-term price trajectory. Moving higher, the chart transitions through green, yellow and orange bands before reaching the red areas. Historically, these upper zones have been associated with periods of strong growth, heightened optimism and high Bitcoin valuations compared with its long-term trend.
This simple color system is one of the main reasons why the Rainbow Chart has become so popular. Users do not need to understand a complex mathematical model to quickly get an idea of where the current price stands compared with the past. However, the colored bands should not be treated as fixed investment rules or automatic buy and sell signals. A blue zone does not mean that Bitcoin must start rising, just as a red zone does not automatically mean that a price decline will follow. Their main value lies in helping place the current price within a broader historical context.
How Did the Rainbow Visualization of Bitcoin’s Price Originate?
The history of the Rainbow Chart dates back to 2014. At the time, Bitcoin was in a bear market following the collapse of the Mt. Gox exchange, and investor sentiment was significantly weaker than during the previous period of growth.
It was during this period that a Reddit user known as azop began posting images of colored charts on r/Bitcoin showing Bitcoin’s long-term price trend. The original version did not yet feature the distinctive curved shape we know today. Instead, it consisted of straight colored bands plotted on a logarithmic chart.
The idea was simple: filter out Bitcoin’s extreme volatility and look at its price from a broader perspective. The colored zones also made it easy to distinguish periods when Bitcoin appeared relatively cheap or expensive compared with the trend observed up to that point. The chart became popular among users, but its creator stopped updating it at the end of 2017. The concept, however, did not disappear and eventually became widely recognized across the crypto community.
The Chart’s Current Form and Its Development
In early 2019, the creator of the BlockchainCenter website, known as Rohmeo, returned to the original idea. His goal was to create an online version of the chart that, unlike static images, would automatically update alongside Bitcoin’s price. He published the first live version on May 19, 2019. However, it was still based on the original concept, in which the colored bands effectively formed a straight line on a logarithmic scale. This meant that the model assumed continued exponential growth in Bitcoin’s price, something that would become increasingly difficult to sustain over the long term.
Rohmeo found a solution in another model that had also been created during the 2014 bear market. A BitcoinTalk user known as trolololo had developed a Bitcoin price model based on logarithmic regression. Its curve gradually flattened over time, reflecting the assumption that Bitcoin’s growth rate would gradually slow down. Rohmeo combined this regression curve with the colored bands of the original Rainbow Chart, creating the characteristic curved shape that later became widely recognized among crypto investors. One of trolololo’s regression curves became the basis for the upper section of the new chart, while the other colored bands were arranged around it.
This version did not remain unchanged either. During the market downturn in 2022, Bitcoin’s price fell below the boundaries of the original colored bands, showing that a model based on data from 2014 no longer reflected the market’s development as well as it once had. On November 21, 2022, BlockchainCenter therefore introduced Rainbow Chart V2, which used an additional nine years of price data to calculate a new curve. The basic color concept remained the same, but the underlying curve used to position the individual bands was adjusted.
The chart has continued to evolve since then. BlockchainCenter now also displays a dynamic version of the Rainbow Chart that is no longer based on a single fixed equation. The model is continuously recalculated using Bitcoin’s complete available daily price history since 2012 and applies Power Law regression. This allows the chart to adjust as new data becomes available instead of remaining tied to parameters established years ago. What began as a simple colored image in 2014 has therefore gradually evolved into a live chart that continues to change alongside Bitcoin’s growing price history.
What Can the Rainbow Chart Be Useful For?
The Rainbow Chart is most useful when looking at the market from a long-term perspective. Bitcoin remains a volatile asset, and its sharp short-term price movements often influence investor sentiment. Over a period of several years, however, these movements represent only one part of a much broader market cycle.
The chart therefore helps place Bitcoin’s current price into a wider context. It shows how Bitcoin behaved during previous periods of growth, decline and market peaks, and where today’s price stands compared with the long-term trend. At the same time, it can help shift attention away from everyday market fluctuations. Instead of focusing on whether Bitcoin has risen or fallen by several percent over the past week, an investor can look at its development over a period of many years.
Can the Rainbow Chart Predict Bitcoin’s Price?
The simple answer is no. The Bitcoin Rainbow Chart is not a tool that can reliably predict Bitcoin’s future price. It is therefore important to view it primarily as a visualization of historical development rather than as a model that the market will necessarily follow in the future.
BlockchainCenter, which operates the Rainbow Chart, describes it in a similar way. Its original purpose was to provide a simple and entertaining way to visualize Bitcoin’s long-term price development. It was never intended to be a scientifically proven model capable of determining future price levels or precisely identifying the right time to buy or sell.
One of the Rainbow Chart’s main limitations is that it relies primarily on historical price data. The market, however, is influenced by many factors that the chart cannot anticipate in advance. These may include changes in interest rates, crypto regulation, economic crises, technological developments, or significant inflows and outflows of capital from the crypto market.
This is also why the Rainbow Chart has evolved over the years and why its model has had to be adjusted. The colored bands should therefore not be viewed as fixed boundaries within which Bitcoin’s price must remain. The fact that a certain price pattern appeared in the past does not mean that Bitcoin will follow the same pattern in the future. The Rainbow Chart can provide an interesting perspective on how the current price compares with Bitcoin’s long-term development, but on its own it cannot tell us where the market will move next.
Conclusion
The Bitcoin Rainbow Chart is one of the best-known visualizations of Bitcoin’s long-term price development. Its purpose is not to determine precisely where the price will move over the next few days or weeks. Its real value lies in providing a broader view of the market over a longer time horizon.
The colored bands make it easy to compare the current price with how Bitcoin behaved in the past. Instead of focusing only on short-term fluctuations, users can see where the price stands within its broader historical development. This wider perspective can be particularly useful during periods when the market is moving rapidly and short-term price changes attract most of the attention.
The story behind the chart itself is also noteworthy. It began in 2014 as a simple and light-hearted way to visualize Bitcoin’s price. Over time, however, it became widely recognized throughout the crypto community and is now frequently used to illustrate long-term market cycles. That does not mean its colored bands should be treated as a precise investment guide. The Rainbow Chart is based on historical data and a selected mathematical model, while future price development may look completely different. Simply entering a particular band does not mean that Bitcoin must subsequently rise or fall.
The Rainbow Chart’s greatest strength lies in its simplicity. In a single chart, it can display many years of Bitcoin’s development and place the current price within a historical context. Rather than answering the question of what will happen to the price tomorrow, it shows where Bitcoin stands compared with previous periods. For this reason, the Rainbow Chart is best viewed as an indicative map of the market’s long-term development. It can help users better understand the broader picture, but when making investment decisions, it should remain only one of several sources of information.
Invest with Fumbi Today
Take advantage of the potential of cryptocurrencies easily, safely, and efficiently. Start investing with Fumbi with amounts starting from just €10. The Fumbi Algorithm in the Fumbi Index Portfolio tracks cryptocurrency market movements for you. If you want to create your own crypto portfolios, choose the Advanced Portfolios product, where you’ll have access to over 120 cryptocurrencies and templates created by our team, focusing on different areas of the crypto world.
REGISTEREncountered a term you don’t understand? No worries! All important crypto-related terms can be found in one place in our new Fumbi Dictionary.

Juraj Ostertag 
Fumbi


