
 5 min •
Daniel Mitrovsky
5 min •
Daniel Mitrovsky
Basic Crypto Metrics to Help You Navigate the Market
Although cryptocurrencies and virtual assets represent an exciting opportunity for investors to significantly evaluate their funds, navigating the crypto market is not easy. With the mainstream adoption and penetration of cryptocurrencies into the media space, many novice investors are entering the crypto market on a daily basis, for whom cryptocurrencies are largely unknown. For this reason, our experts from Fumbi have prepared a blog for you dealing with basic metrics from the world of cryptocurrencies, which are definitely worth following when deciding on an investment.

Market Capitalisation
Tracking the prices of individual cryptocurrencies on the market is not nearly as informative as it might seem at first glance. The fact that some asset costs 50 dollars and another costs 0.5 dollars does not mean that the more expensive asset is stronger and more stable. Behind the different prices between cryptoassets lies the magic related to the circulating and total supply of assets.
For a proper understanding of the strength and size of crypto projects, it is therefore recommended to monitor the market capitalisation indicator, which measures the relative size of cryptocurrencies on the market. The market capitalisation of crypto projects is calculated according to the formula:
Asset market capitalization = asset price * amount of units in circulation
We can use a model example with Litecoin and Cardano cryptocurrencies to clarify the market capitalisation calculation. Currently, the price of one Litecoin cryptocurrency is approximately $52.8, and there are 70,998,000 LTC in circulation. This means that Litecoin’s market capitalisation is roughly $3.74 billion. On the other hand, the price of Cardano cryptocurrency is only $0.44, but there are as many as 33.73 billion ADA in circulation. This means that the market capitalisation of Cardano is about 15 billion dollars, up to 4 times more than in the case of Litecoin.
Market capitalisation provides investors with an important aid in their investment decisions, as it provides insight into the size of given crypto projects. It can also help investors determine whether a crypto project is overvalued or undervalued.
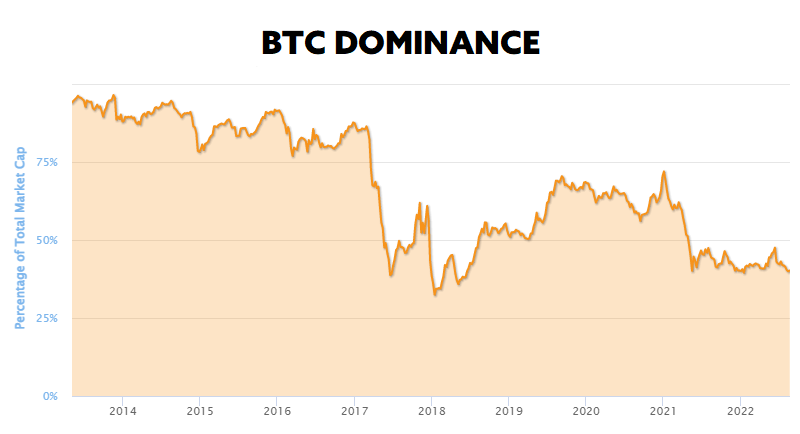
Bitcoin Dominance
The indicator of Bitcoin’s dominance in the cryptocurrency market is determined by the ratio of Bitcoin’s market capitalisation to the market capitalisation of all existing cryptocurrencies.
In the past, especially in the early days of cryptocurrencies, Bitcoin’s dominance ranged from 80 to 90%. Gradually, however, many altcoins began to appear on the market, which, thanks to their various approaches and use cases, began attracting investors’ attention. With the growing number of altcoins in the market, it is not surprising that Bitcoin’s dominance is diminishing over time.
Many investors use the Dominance Indicator to identify current market trends. For example, when asset prices on the market are rising, but at the same time, Bitcoin’s dominance is declining, it signals the so-called altcoin season. During the altcoin season, various assets tend to generate higher returns than Bitcoin itself, causing its dominance to weaken at this stage. Investors who trade not only with Bitcoin but also with altcoins use this indicator and optimise their investment portfolios based on it.
But using Bitcoin’s dominance to spot the current market trend isn’t just about altcoin season. Based on the price of BTC and its dominance, it is possible to predict other development trends, such as:
- If the price and dominance of BTC rise, it could signal a potential bull market for Bitcoin.
- If the price of BTC is falling and its dominance is growing, this may signal a bear market for altcoins.
- If the price and dominance of BTC are declining, it may signal a bearish trend for the cryptocurrency market as a whole.
However, the Bitcoin dominance indicator should only be seen as a guide for investors in their investment decisions.
Fear & Greed Index
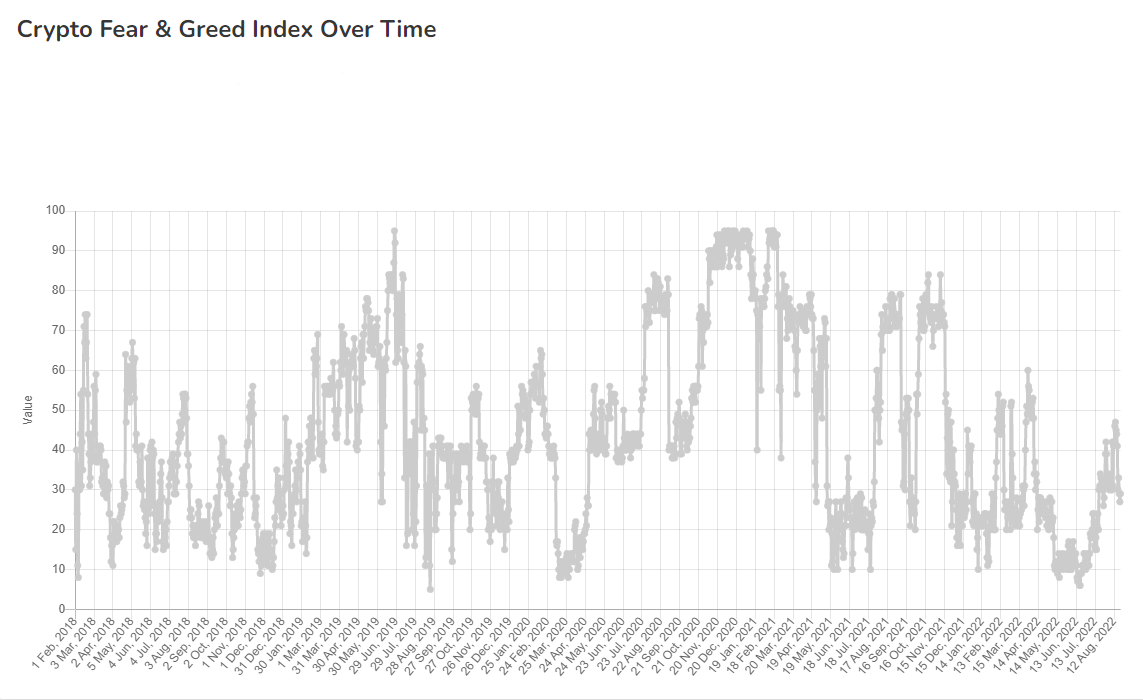
One of the indicators that combines fundamental and sentimental market factors is the Fear & Greed Index. Especially newcomers to the world of cryptocurrencies can find this index helpful and give them a picture of the current market situation and sentiment.
The Fear & Greed Index is a market indicator focused on a multi-criteria analysis of market sentiment. The index analyses a notional basket of various trends and market factors on a daily basis to determine whether market participants are greedy or fear-driven. The index is scored from 0 to 100, where an index score of 0 indicates extreme fear, while 100 indicates extreme greed.
The index calculates its value by combining six weighted market factors, including volatility, market volumes and market dynamics, social networks, Bitcoin dominance, Google trends and surveys.
The Crypto Fear and Greed Index can be a valuable tool to monitor changes in market mood and sentiment. Because the index tracks a variety of fundamental market metrics, tracking this index can provide individual investors with the opportunity to enter or exit the market before other investors.
Exchange Flows
A strong and significant indicator of the market situation is the metric of inflows and outflows of assets from stock exchanges. This metric tracks the inflows and outflows of bitcoins or other assets to exchanges, which can identify potential investor behaviour.
For example, if investors expect the price of Bitcoin to fall, they move their assets from private wallets to exchanges to sell them. The transfer of bitcoins to exchanges thus causes an increase in selling pressure, which translates into a decrease in its price.
However, if investors expect the price of Bitcoin to increase in the future, they move their BTC from exchanges to private wallets for long-term holding, mainly due to higher security. In this case, there are fewer assets available for sale on exchanges, which puts upward pressure on the price of BTC.
Investors use this useful metric to predict the price behaviour of Bitcoin or other assets in the future. The stock market inflows and outflows indicator is very popular among investors.
Open Interest
Another way to measure the current interest in investing in cryptocurrencies is the so-called open interest of investors. It is one of the most popular metrics based on the traded volume, which represents the total volume of long and short positions held by investors at the observed moment. This indicator is associated with options and futures contracts.
Investors’ open interest indicates the inflow of capital into the market – if capital flows into the market, the open interest indicator increases. However, the opposite is also true. If liquidity is leaking from the market, the open interest indicator also decreases.
This indicator is a useful tool for analysing stock options and futures markets. It provides an overview of the level of activity in a given market and can be used to measure the level of interest in a particular asset. It is also often used to identify undervalued and overvalued options in the market. In addition, experts use it to analyse trends. Rising open interest indicates that new traders are entering the market and can be used to confirm the current market trend. Falling open interest shows that traders are closing their positions, and the current trend may be weakening.
TVL – Total Value Locked
The indicator of assets’ total value locked is primarily associated with the decentralised finance (DeFi) sector, but it is also used in the determination of locked assets on smart contract protocols. This indicator represents the value of all assets contained in DeFi protocols, which users have locked into smart contracts for the purpose of providing liquidity and collecting revenues.
TVL has become a key metric for evaluating DeFi projects because it provides a comprehensive view of the overall health of the protocol. By analysing the value associated with the assets embedded in the protocol, it is possible to track people’s interest in a particular protocol in the DeFi ecosystem.
The way TVL is measured is different on different DeFi protocols because each protocol or service in DeFi operates according to its specific structures and these differences affect the calculation of the total locked value.
For example, lending-focused protocols measure their TVL based on assets deposited into smart contracts by both lenders and borrowers. In contrast, derivatives-focused protocols measure TVL by the value of assets stored in smart contracts that provide cover for synthetic assets and financial contracts.
If an investor is considering investing his funds in the DeFi protocol, the metric of the total locked value can significantly help him choose a liquid and financially sound protocol.
OPEN PROFILE
Daniel Mitrovsky 
Head of Crypto, Fumbi


Biography
Specializes in cryptocurrency market analysis, investment strategies, and technological trends in the blockchain space. With over 5 years of experience in financial markets, he has been actively involved in cryptocurrencies for more than 8 years. On the Fumbi blog, he brings you the latest news from the world of cryptocurrencies, comments on market developments, and clearly explains various investment approaches – from basics to advanced strategies.