
 3 min •
Juraj Ostertag
3 min •
Juraj Ostertag
What Is Bitcoin Dominance and How to Use This Indicator in Practice
Bitcoin dominance is an important indicator that has been used since the emergence of the first altcoins. In this article, we will explain its history, why this indicator matters, how it is calculated, and what it tells us about the current market situation.

What Is Bitcoin Dominance?
BTC dominance represents Bitcoin’s share of the total cryptocurrency market capitalization. When dominance rises, Bitcoin usually performs better than altcoins or attracts a larger share of capital. A decline in dominance may indicate that money is moving into Ethereum and other altcoins. However, dominance itself does not show the direction of Bitcoin’s price, which is why it is mainly used as a supplementary indicator of market development.
How Is It Calculated?
The calculation is simple: Bitcoin’s market capitalization is divided by the total cryptocurrency market capitalization and the result is multiplied by one hundred. If Bitcoin has a market capitalization of $2 trillion and the entire crypto market is worth $3.5 trillion, Bitcoin dominance is approximately 57%.
The current value can be tracked on platforms such as CoinMarketCap or CoinGecko. On TradingView, it is available under the ticker BTC.D and is displayed like a regular price chart, including candlesticks.
An important detail is that total market capitalization also includes stablecoins. These represent billions of dollars held in assets that are not designed to appreciate in price and therefore do not directly compete with Bitcoin. Some analysts therefore also track Bitcoin dominance excluding stablecoins to obtain a more accurate picture of how capital is distributed between Bitcoin and altcoins.
History of the Indicator
The Emergence of BTC
Bitcoin was launched in 2009 and remained the only existing digital asset during its first two years. In 2011, the first alternative cryptocurrency appeared, and by 2013 additional projects had begun to emerge. Despite this early competition, Bitcoin dominance remained at approximately 95% during this period. Since only a small number of altcoins were in circulation, their share of the total market capitalization remained very low.
Ethereum was launched in 2015 as a blockchain platform designed for broader use than just peer-to-peer payments. Ethereum introduced smart contracts and its own native cryptocurrency, ether (ETH). However, BTC dominance remained above 90% for most of 2015 and throughout 2016. The real turning point came in 2017.
The Initial Coin Offering (ICO) Era
Between 2017 and 2018, initial coin offerings, known as ICOs, became a popular way of financing new crypto projects. Thousands of new tokens entered the market, and capital began shifting from Bitcoin into altcoins. As a result, BTC dominance fell to what was then a record low of approximately 37% in January 2018.
The ICO boom did not last long. Many projects lacked credible fundamentals, while others came under increased scrutiny from regulators. As market sentiment deteriorated, the cryptocurrency market entered a prolonged downturn. Altcoins lost significantly more value than Bitcoin, and BTC dominance gradually recovered to above 50% by the end of 2018.
Recovery and the 2020–2021 Bull Market
Bitcoin’s price stabilized during 2019, while its dominance reached approximately 70% in September. In 2020, a combination of factors, including economic stimulus during the pandemic, growing interest from retail investors, and increasing institutional attention, triggered a significant bull market.
During this period, the expansion of decentralized finance (DeFi) and NFTs also attracted capital to competing blockchains. BTC dominance initially climbed to approximately 72% in January 2021, but fell to around 39% by the middle of the year as altcoins began to outperform Bitcoin.
From the Bear Market to the Institutional Era
The 2022 bear market was one of the most severe in cryptocurrency history. Several major collapses, including the failure of the Terra/LUNA ecosystem in May 2022 and the FTX exchange in November 2022, had a particularly significant impact on the altcoin market.
BTC dominance increased during this period as investors moved away from riskier assets toward Bitcoin, which represented a larger and more established asset.
The market began to recover in 2023. Bitcoin led the recovery and its dominance gradually increased. Investors increasingly viewed it as one of the most firmly established assets in the crypto sector, supported by its limited supply and growing recognition among institutional investors.
Spot Bitcoin ETFs and the 2024 Halving
January 2024 marked another major turning point. U.S. regulators approved the first spot Bitcoin ETFs, allowing both institutional and retail investors to gain exposure to Bitcoin through traditional brokerage accounts without having to hold the cryptocurrency directly. This resulted in significant capital inflows and contributed to Bitcoin reaching new price highs.
Spot Ethereum ETFs followed in July 2024, providing similar institutional access to ether. Although both types of ETFs attracted capital, inflows generally favored Bitcoin, supporting further growth in its dominance.
In April 2024, Bitcoin underwent its fourth halving, reducing the block reward from 6.25 BTC to 3.125 BTC. Historically, halvings have often preceded periods of rising Bitcoin prices, although past performance does not guarantee future results. Combined with ETF inflows, BTC dominance increased to multi-year highs above 60% during 2024.
In 2025 and throughout 2026, Bitcoin dominance remained elevated compared with the lows seen after 2021. Institutional adoption through ETFs introduced a new group of investors who focus primarily on Bitcoin rather than the broader altcoin market. This situation continues to this day.
Historical Development of BTC Dominance
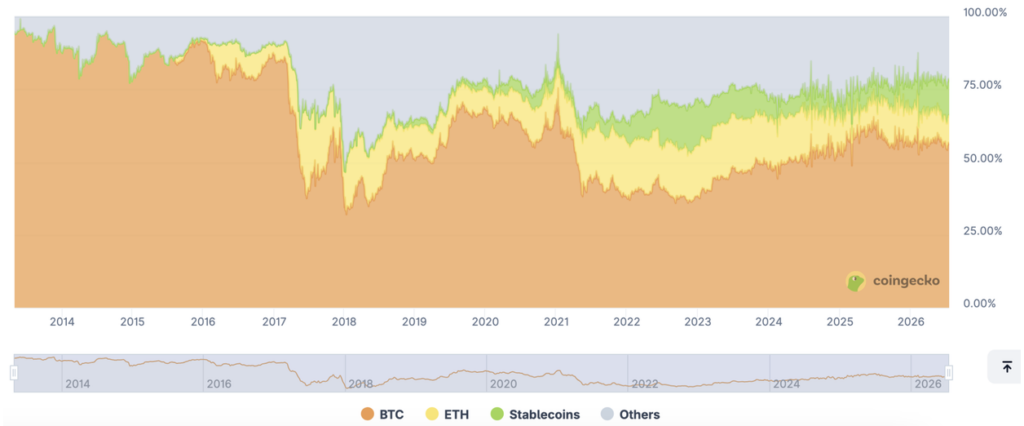
Source: CoinGecko
Three Basic Bitcoin Dominance Scenarios
1. Dominance Rises While the Overall Market Rises
New capital is entering the cryptocurrency market, but most of it flows into Bitcoin. This is typical of the early stages of a bull market cycle, when investors first return to the largest and best-known cryptocurrency. Bitcoin may therefore rise faster than most altcoins, increasing its share of the total market capitalization.
2. Dominance Falls While the Overall Market Rises
Capital gradually shifts from Bitcoin into altcoins, where investors expect higher potential returns. Bitcoin may continue to rise, but altcoins grow faster, causing Bitcoin dominance to decline. If this trend is strong and sustained, the crypto community often interprets it as a sign that an altcoin season may be beginning.
3. Dominance Rises During a Falling Market
Investors sell riskier altcoins and move capital into Bitcoin, or leave the cryptocurrency market entirely. Altcoins usually lose more value than Bitcoin during market downturns, causing their share of the total market to decline. Rising dominance in this situation therefore does not necessarily mean that Bitcoin’s price is increasing, but rather that Bitcoin is showing greater resilience than the rest of the market.
What Does Bitcoin Dominance Not Show?
Bitcoin dominance is a useful indicator, but on its own it does not provide a complete picture of the cryptocurrency market. In particular, it does not account for the following factors:
- It does not show whether Bitcoin’s price is rising or fallingDominance can increase even while the market is declining if altcoins lose value faster than Bitcoin.
- It does not show inflows of new capitalChanges in dominance may result from existing capital moving between Bitcoin and altcoins rather than from new investments entering the market.
- It does not show the performance of individual altcoinsSome altcoins may rise significantly even when Bitcoin dominance remains stable.
- It does not show trading volumesHigh dominance does not automatically mean that Bitcoin has higher trading volumes than other cryptocurrencies.
- It does not account for blockchain activityDominance does not show the number of transactions, active users, or usage of specific blockchains.
- It does not show investor sentimentOther indicators are needed to assess fear, greed, or market expectations.
- It does not accurately account for stablecoinsGrowth in stablecoin market capitalization can affect Bitcoin’s overall market share without reflecting a meaningful change in investor interest in altcoins.
- It does not show the level of market riskDominance cannot be used to accurately determine volatility or the probability of further market growth or decline.
- It does not confirm the beginning of an altcoin seasonA decline in dominance may indicate that capital is shifting into altcoins, but it is not sufficient on its own to confirm the beginning of an altcoin season.
- It is not a reliable buy or sell signal
Low dominance may indicate a more developed and diversified ecosystem, but it may also reflect a speculative bubble in tokens with little or no real-world utility. Bitcoin dominance is therefore more useful as broader market context than as a standalone buy or sell signal.
Market Cycle Map
Analysts use Bitcoin dominance as a tool for identifying different stages of the market cycle.
At the beginning of a cycle, dominance typically rises because cautious capital tends to return to Bitcoin first. During a more mature phase, Bitcoin may move sideways near its highs while dominance begins to decline as capital shifts into Ethereum and larger altcoins. During a phase of market euphoria, dominance may fall sharply while almost the entire market rises and investors increasingly seek more speculative tokens. When a bear market arrives, dominance often recovers because altcoins tend to fall more sharply and the remaining capital seeks relative safety in Bitcoin.
This indicator is increasingly monitored alongside Ethereum dominance, which measures the strength of the second-largest crypto ecosystem, and the ETH/BTC pair, which provides a more precise view of capital rotation between Bitcoin and Ethereum. No indicator can reliably predict future market developments. However, understanding the likely stage of the market cycle can significantly influence which risks may be reasonable to take.
Conclusion
Bitcoin dominance is one of the most important indicators for understanding how capital is distributed across the cryptocurrency market. Rising dominance often indicates a stronger position for Bitcoin, while falling dominance may signal that investor interest is shifting toward Ethereum and other altcoins.
Historical developments show that dominance changes significantly depending on the stage of the market cycle, investor sentiment, and the emergence of new trends. In recent years, it has been supported primarily by growing institutional adoption of Bitcoin, the approval of spot ETFs, and Bitcoin’s position as the largest cryptocurrency.
However, dominance alone does not indicate whether the price of Bitcoin or the overall market is rising or falling. It should therefore not be used as a standalone buy or sell signal, but rather in combination with other market indicators. A proper understanding of BTC dominance can help investors better navigate the market cycle and assess risks more realistically.
Invest with Fumbi Today
Take advantage of the potential of cryptocurrencies easily, safely, and efficiently. Start investing with Fumbi with amounts starting from just €10. The Fumbi Algorithm in the Fumbi Index Portfolio tracks cryptocurrency market movements for you. If you want to create your own crypto portfolios, choose the Advanced Portfolios product, where you’ll have access to over 120 cryptocurrencies and templates created by our team, focusing on different areas of the crypto world.
OPEN PROFILEEncountered a term you don’t understand? No worries! All important crypto-related terms can be found in one place in our new Fumbi Dictionary.

Juraj Ostertag 
Fumbi


