
 3 min •
Juraj Ostertag
3 min •
Juraj Ostertag
One Year After the Major Sell-Off: Bitcoin Liquidity Rises, Altcoins Still Lag Behind
The sell-off on October 10, 2025, wiped out more than $19 billion in leveraged positions in a single day. It demonstrated how quickly the cryptocurrency market can collapse when buyers disappear. One year later, trading conditions for Bitcoin and Ethereum have improved significantly. However, many altcoins are still lagging behind. Why is liquidity returning to the market so unevenly, and what does this mean for investors?

The Sell-Off That Exposed Market Weaknesses
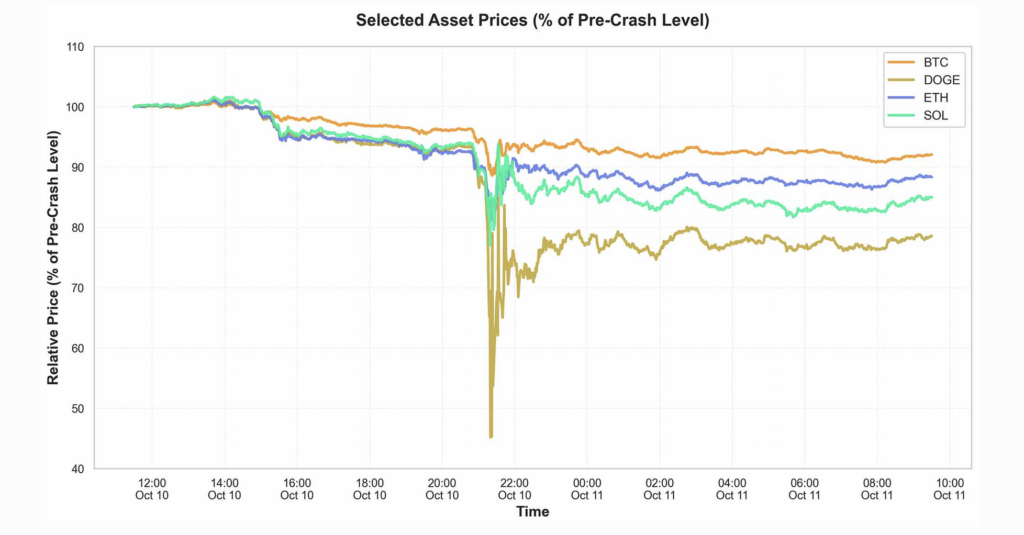
On October 10, 2025, Bitcoin was trading at approximately $122,600 before the market turmoil began. During the sharp sell-off, however, its price fell below $105,000. Within 24 hours, cryptocurrency exchanges forcibly liquidated leveraged positions worth more than $19 billion. This was not simply a dramatic price movement. The sell-off revealed what happens when the number of sellers suddenly increases while buyers disappear from the market.
The major sell-off was triggered by tensions in trade relations between the United States and China. However, the extent of the decline was also significantly influenced by the widespread use of leverage among traders. In leveraged trading, even a relatively small price decline can reduce the value of collateral, prompting exchanges to automatically close open positions. These forced sales push prices even lower, triggering further liquidations. The result is a chain reaction that significantly amplifies the initial decline. This is exactly what happened in October 2025.
The situation becomes even worse when traders who normally provide buy orders withdraw from the market. Sellers suddenly struggle to find buyers willing to purchase at the expected price. Because some investors use shared collateral across multiple cryptocurrencies, selling pressure can quickly spread to other tokens. These situations demonstrate why monitoring prices alone is not enough. The amount of liquidity supporting those prices is equally important.
Liquidity Shock Chart as of October 10, 2025
Source: FTI Consulting
What Is Liquidity and Why Does It Matter?
Liquidity describes how easily a cryptocurrency can be bought or sold without significantly affecting its price. In a liquid market, there are enough buyers and sellers to absorb even relatively large orders without causing sharp price movements. When liquidity is weak, even a relatively small transaction can move the price significantly.
Imagine a token whose last traded price is €10. On the screen, everything looks straightforward: one token is worth €10. However, buyers may only be willing to purchase a few tokens at that price. Additional buy orders might be waiting at €9.80 or €9.50. If an investor sells a large number of tokens at once, some will be sold at lower prices. The difference between the expected price and the actual execution price is called slippage.
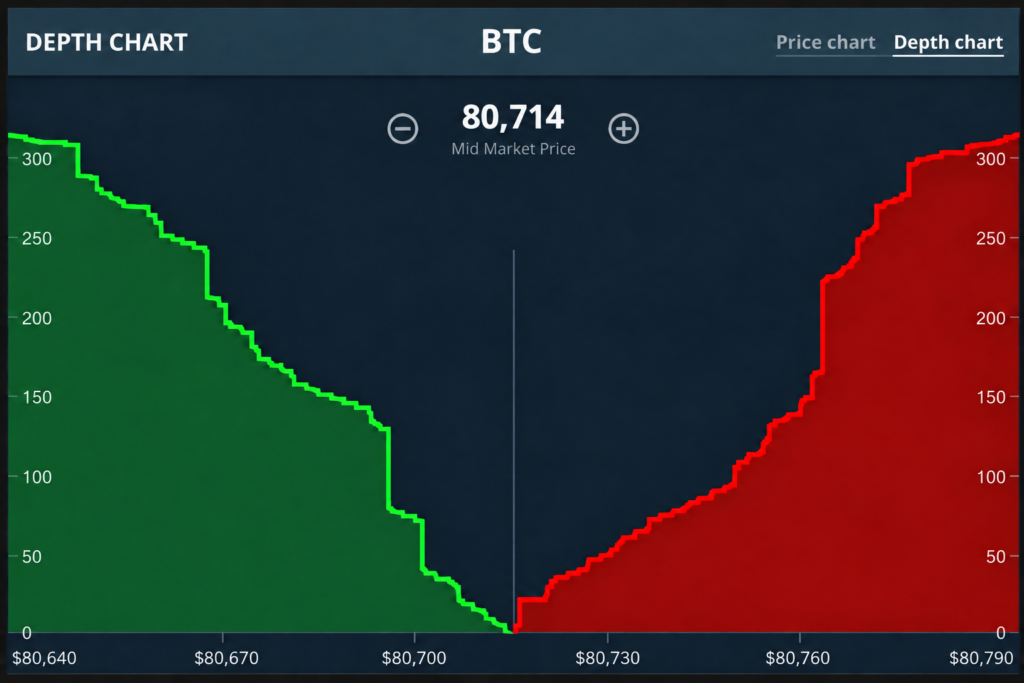
This is why analysts often monitor order book depth alongside other indicators. An order book shows the volume of buy and sell orders waiting near the current market price. Analysts frequently compare the value of orders within 0.5%, 1%, or 5% of that price. The more capital available within a given range, the larger the transaction the market can generally absorb without a significant price movement.
Another important indicator is the spread, which represents the difference between the highest bid and the lowest ask price. If someone is willing to buy a token for €9.98 and the cheapest seller is asking €10.02, the spread is four cents. In an active market, this difference is usually narrower. During periods of uncertainty, spreads widen as traders increase their margins to account for additional risk.
Liquidity should not be confused with trading volume. Trading volume shows how much has already been traded, while market depth indicates how many orders are available for upcoming transactions. During periods of panic, trading volumes can reach record levels even as trading conditions deteriorate sharply. Furthermore, orders in an order book are not binding commitments: traders can cancel them within seconds. Therefore, what matters is not only how much liquidity exists, but also how long it remains available.
Illustrative BTC Market Depth Chart
Source: Fumbi
Bitcoin: Buyers and Sellers Are Returning
Among the major cryptocurrencies, Bitcoin has recorded the most significant improvement. As of October 12, 2026, the dollar-denominated depth of its order book within 1% of the current price reached approximately $11.7 million. This represents a 75% increase compared with the day of the major sell-off. At the beginning of 2026, the figure stood at roughly $9 million, compared with approximately $6.9 million at the beginning of 2025.
These figures are based on selected centralized exchanges rather than the entire global Bitcoin market. Nevertheless, they reveal a clear trend: more buy and sell orders are once again available near the current market price. Interestingly, Bitcoin’s price remains lower than it was immediately before the October 2025 sell-off. The improvement therefore concerns not only price performance but also the underlying conditions in which Bitcoin is traded.
Ethereum Is Recovering but Still Trails Bitcoin
Ethereum’s order books have also strengthened. Market depth within 0.5% of the current price has more than doubled to approximately $4.2 million. Within the 1% range, it has increased by roughly 75% to $5.3 million. This means that more traders are now willing to buy and sell ETH close to its market price.
However, Ethereum still lags behind Bitcoin. Another measurement focusing on a much narrower range of 0.15% around the market price showed that ETH liquidity reached only approximately 35–45% of comparable Bitcoin liquidity. Previously, this ratio had been at least 60%.
At first glance, these figures may appear contradictory, but they actually describe two different situations. The first compares Ethereum’s current liquidity with its own position a year earlier. The second compares Ethereum with Bitcoin across a different set of markets and within a narrower price range. Ethereum has improved, but Bitcoin has advanced even further according to certain indicators. This is why it is important to understand which exchanges and price ranges are included when interpreting similar statistics.
Ethereum has an extensive ecosystem of decentralized applications, stablecoins, and financial services. However, this does not automatically mean that ETH can be traded as easily as Bitcoin. The technological use of a blockchain network and the liquidity of its native cryptocurrency are two separate matters.
Smaller Cryptocurrencies Continue to Face Weaker Liquidity
The situation is considerably less favorable for smaller cryptocurrencies. Within the monitored group of altcoins, order book depth had already been declining since the beginning of 2025. Within the 5% price range, it fell by approximately one-third to $2 million. Within the 1% range, it declined by roughly one-sixth. While Bitcoin and Ethereum have seen their order books strengthen, many smaller tokens still lack sufficient capital available for buying and selling.
The difference becomes particularly noticeable with larger transactions. Selling €100,000 worth of one token may have little impact on its price. For another token, the same transaction could quickly exhaust available buy orders, causing the remaining portion to execute at significantly lower prices. Weak liquidity works in both directions. Sometimes, a sharp price increase occurs simply because there are too few sell orders in the order book.
However, not all altcoins are alike. Major projects such as Solana and XRP have different trading infrastructures compared with lesser-known tokens available on only a handful of exchanges. Liquidity also varies depending on the specific platform and trading pair. Strong liquidity on one exchange does not guarantee similar trading conditions elsewhere.
The number of tokens in circulation and their gradual release also play a role. When a large batch of tokens held by early investors or a project’s team enters circulation, the potential supply increases. If buying interest is weak, prices become more sensitive to this additional supply. However, a token unlock does not automatically mean that holders will begin selling.
Even a high market capitalization does not guarantee strong liquidity. Market capitalization is calculated by multiplying the current price by the number of tokens in circulation. It does not indicate how much capital is actually available to purchase those tokens. Consequently, even a token with a market capitalization in the billions can struggle to absorb a large sale without significant slippage.
Why Is Capital Returning Primarily to Major Cryptocurrencies?
Professional market makers play an important role. They continuously place buy and sell orders on exchanges, helping maintain smooth trading conditions. During sharp market declines, however, market makers also reduce their exposure to risk. They decrease order sizes, widen spreads, or temporarily withdraw from the market. Once conditions stabilize, they do not necessarily return to every cryptocurrency at the same pace.
Bitcoin and Ethereum benefit from extensive trading infrastructure. Both are listed on numerous exchanges and have well-developed derivatives markets, custody services, and products designed for professional investors. This makes it easier for large traders to hedge risks or close substantial positions. With smaller tokens, purchasing a large amount may be relatively straightforward, but selling it later could significantly affect the price.
Spot trading activity, which involves buying and selling cryptocurrencies without using derivatives, also provides an interesting perspective. During the four weeks ending September 27, 2026, average weekly trading volume on the monitored centralized exchanges was approximately $279 billion. During the week of the October 2025 crash, it reached approximately $801 billion. This represents a difference of almost 66%. It does not mean that the market lost two-thirds of its value. Instead, it illustrates that exceptionally high trading activity during a panic is not necessarily a sign of a healthy market.
On decentralized exchanges, liquidity is also provided through different mechanisms, often using liquidity pools rather than traditional order books. However, the result for users is similar: the weaker the liquidity, the greater the impact a large transaction has on the price. Evaluating the overall cryptocurrency market therefore requires looking beyond a single exchange or trading mechanism.
The Risk That Price Charts Don’t Show
For investors, one point is particularly important: the price displayed in an application does not mean that any amount of cryptocurrency can be sold at that price. The final execution price depends on the order size, the availability of buyers, the specific trading platform and its operating model, and overall market conditions.
Three distinct cost factors affect the final transaction amount:
- Exchange fees represent the cost charged for executing a trading service.
- Spread is the difference between the best available bid and ask prices.
- Slippage occurs when an order is executed at different prices as it is filled.
For less liquid cryptocurrencies, the latter two factors can have a greater impact than the trading fee itself might suggest. There is also an important distinction between market orders and limit orders. A market order aims to buy or sell immediately at available prices, making it more sensitive to slippage. A limit order specifies the price at which an investor is willing to trade. However, if no counterparty is available, the order will not be executed. Each approach therefore involves a different trade-off between execution speed and price control.
Trading can also be disrupted by events outside the blockchain itself, such as exchange outages, suspended transfers, or problems with the stablecoin against which a token is traded. If a stablecoin loses its peg to its reference currency, the meaning of the displayed price in that trading pair also changes. A fast blockchain network therefore does not automatically guarantee that a token has enough buyers or that transactions will always execute at the expected price.
When investing through Fumbi, investors do not need to navigate exchange order books themselves or manage the technical details of individual trades. Fumbi facilitates cryptocurrency purchases and sales through its investment platform and allows investors to spread their investments across multiple cryptocurrencies through diversified portfolios. Diversification helps reduce dependence on the performance of a single cryptocurrency, thereby lowering exposure to price fluctuations specific to that individual asset.
Has the Cryptocurrency Market Recovered from Last Year’s Crash?
The coming months will show whether capital also returns to smaller cryptocurrencies. Rising prices alone will not be enough. More convincing signs of recovery will include deeper order books, narrower spreads, and sustained trading interest across multiple exchanges. The market’s resilience will only be truly tested during the next period of sharp price fluctuations. That will reveal whether buy and sell orders remain available under pressure or whether liquidity once again disappears rapidly.
One year after the significant market decline of October 10, 2025, it is clear that the cryptocurrency market is recovering, but not evenly. Bitcoin and Ethereum have recorded substantial improvements in liquidity, and their trading conditions are now more stable. However, their prices remain significantly below pre-sell-off levels. The market is therefore in better shape than a year ago, although a full recovery has yet to take place.
For many altcoins, however, the situation is different. Liquidity remains weaker, and larger transactions can still have a significant impact on prices. Most altcoins are also trading well below their previous all-time highs, with a return to those levels still appearing distant. The key question is whether capital will gradually return to smaller cryptocurrencies and whether the market can maintain sufficient liquidity during future periods of volatility.
Remember: Price reflects the outcome of the last trade. Liquidity, however, offers insight into how the next one might unfold.
Invest with Fumbi Today
Take advantage of the potential of cryptocurrencies easily, safely, and efficiently. Start investing with Fumbi with amounts starting from just €10. The Fumbi Algorithm in the Fumbi Index Portfolio tracks cryptocurrency market movements for you. If you want to create your own crypto portfolios, choose the Advanced Portfolios product, where you’ll have access to over 120 cryptocurrencies and templates created by our team, focusing on different areas of the crypto world.
REGISTEREncountered a term you don’t understand? No worries! All important crypto-related terms can be found in one place in our new Fumbi Dictionary.

Juraj Ostertag 
Fumbi


